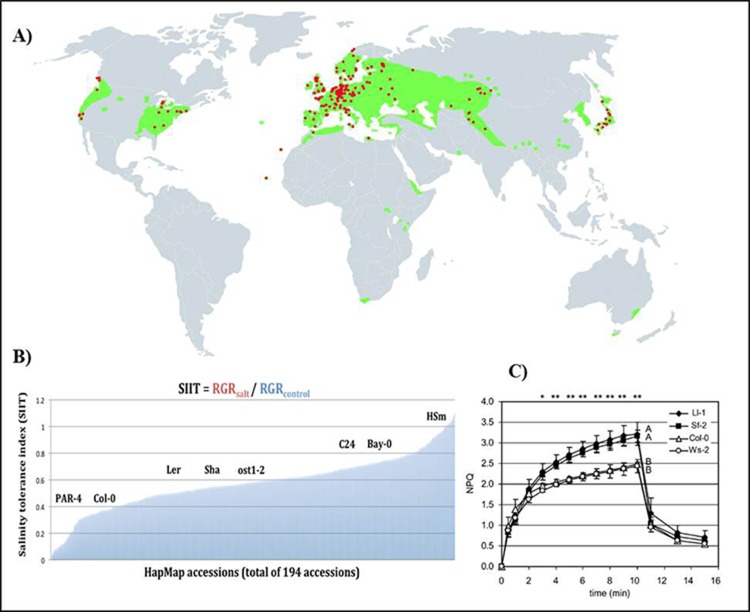
Figure 4.
Natural variation in A. thaliana in abiotic stress responses
(A) Geographic distribution of A. thaliana. The red dots represent original habitat. The green color represent areas that A. thaliana has been naturally spread (Koornneef, 2004). Reproduced with permission of Annual Review of Plant Biology, Volume 55 © by Annual Reviews, http://www.annualreviews.org. (B) Natural variation in salinity tolerance is observed across 194 accessions of the Arabidopsis HapMap population in terms of their relative growth rate (RGR) and shoot-ion independent tolerance (SIIT) index. A selection of well-known Arabidopsis accessions are high-lighted on the SIIT scale, including Col-0, C24 and the parental lines of the bi-parental mapping population Bay and Sha (unpublished). (C) four representative high and low NPQ accessions from a total of 62 A. thaliana accessions screened (Jung and Niyogi, 2009).

