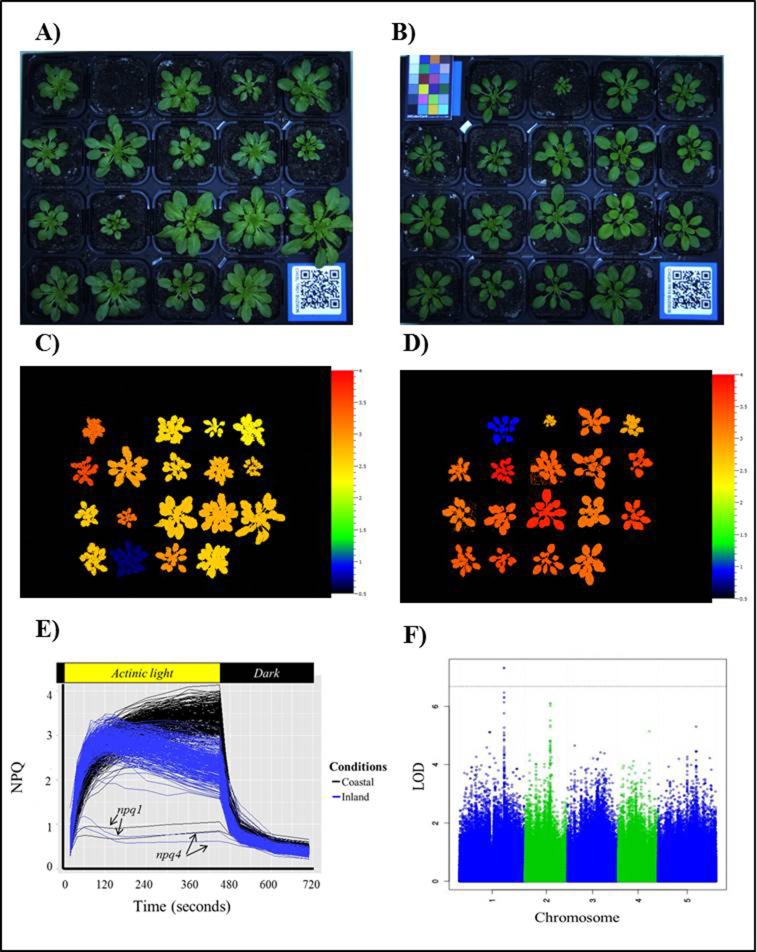
Figure 5.
High throughput chlorophyll fluorescence imaging used in a GWAS approach to determine the genetic architecture of NPQ.
Plants are grown in climate chambers that mimic control (coastal) and stressful (inland) conditions (example of single tray in A & B respectively). Chlorophyll fluorescence at similar growth stages (16 leaves) is measured using a PSI PlantScreen (inland (C) and coastal (D)). Significant variation in NPQ induction, steady state and relaxation of NPQ was seen among the natural accessions grown under the coastal (black) and inland (blue) conditions (E). The lower lines are NPQ mutants (npq1 and npq4) which are unable to produce NPQ in both conditions. GWAS analysis is undertaken to find QTLs associated with the traits of interest (F).

