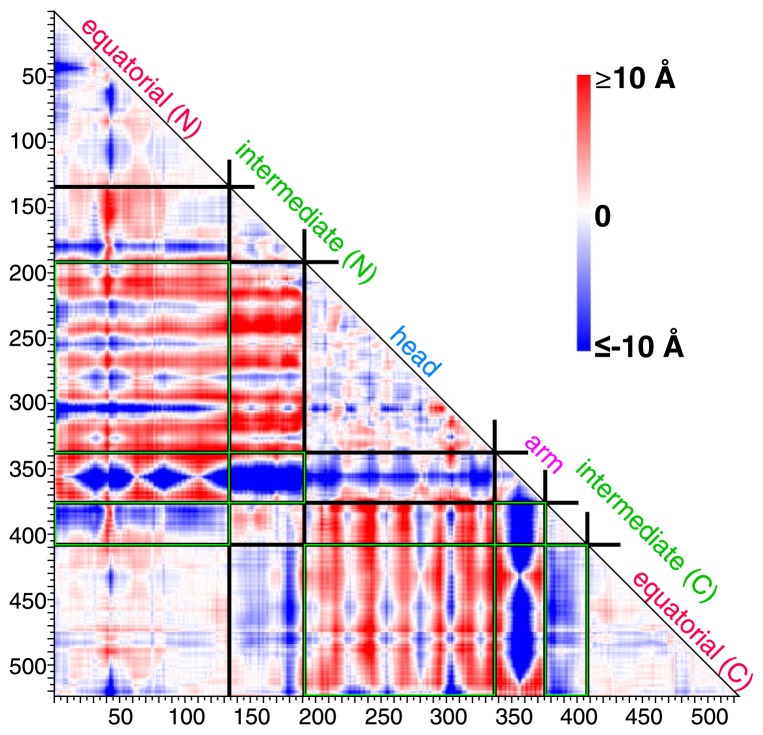
Figure 4.
Difference map between TNM-P and TNM-M. The map shows the subtraction of the distance maps of the final structure in TNM-M from that in TNM-P. Boundaries between domains are shown in black. Difference in the relative location of domains emphasized by the green box is further discussed in Figure 7.

