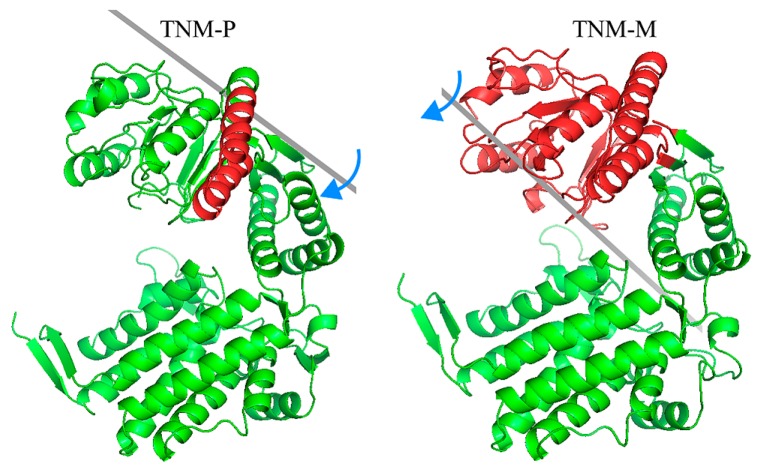
Figure 5.
The domain movement in the first several steps in TNM-P and TNM-M. The two figures show the domain movement in the first several steps in TNM-P and in TNM-M analyzed by DynDom [24]. Red domains are the ones that move mostly. Green domains are the ones fixed in the analysis. Grey bars are the axis of the rotation. Blue arrows indicate the direction to which red domain rotates. These figures were drawn with PyMOL [26].

