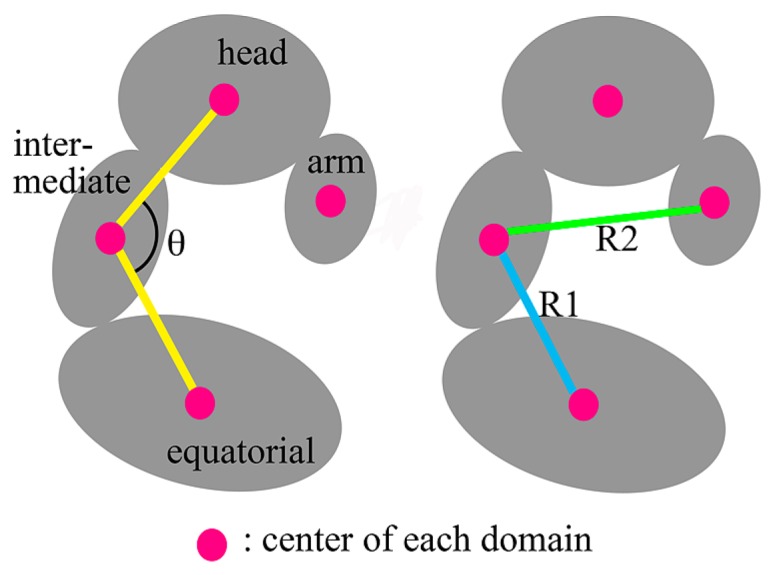
Figure 6.

Diagrams of the quantities for measurement. Magenta circles indicate the positions of the geometrical center of the atoms in each domain. θ is the angle between two yellow lines. R1 and R2 are the lengths (distances) shown by blue and green lines, respectively.
