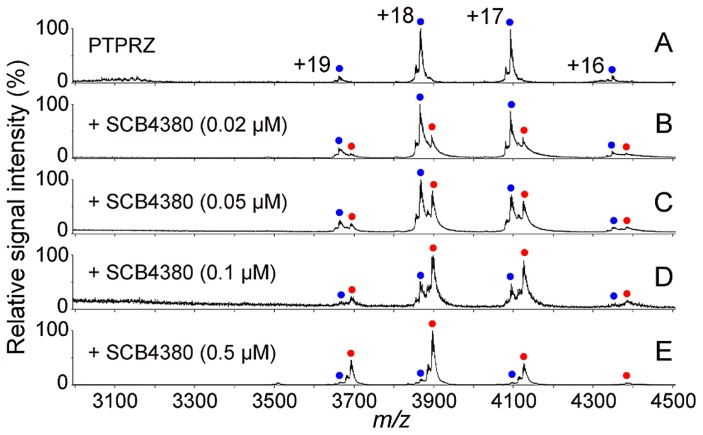
Figure 4.
One-to-one binding of the inhibitor SCB4380 to protein tyrosine phosphatase PTPRZ. MS spectra of PTPRZ in the presence of the inhibitor (A–E). PTPRZ was mixed with the inhibitor at the indicated concentrations, and inhibitor binding to PTPRZ was monitored by MS under non-denaturing conditions. Peaks corresponding to PTPRZ and the 1:1 PTPRZ-inhibitor complex are indicated by blue and red dots (with charge states), respectively (modified from [8]).

