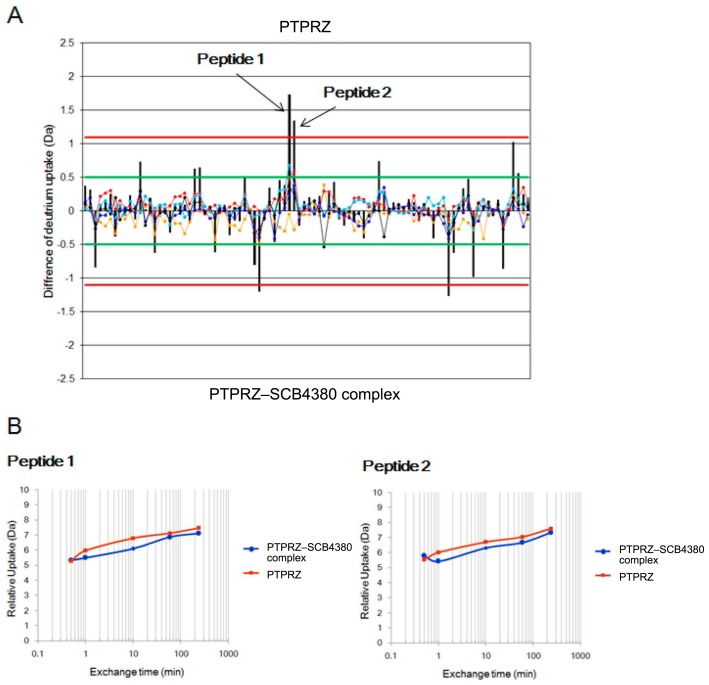
Figure 8.
HDX-MS analysis for determining the binding site between protein tyrosine phosphatase PTPRZ and the inhibitor SCB4380. (A) Differential plot of the average HDX data for the phosphatase peptides without the inhibitor versus with the inhibitor. The orange, red, cyan, blue, and black lines correspond to the average mass difference values calculated for HDX-MS data acquired at different time points. The black vertical bar for each peptide is the sum of the mass differences observed for each peptide. The green lines at ±0.5 Da from the Y axis represent the theoretical 98% confidence limit for each mass difference data time point, whereas the black lines ±1.1 Da from the Y axis values represent the 98% confidence limit for the sum of the mass difference data for each peptide [30]. (B) The hydrogen uptake ratios of two peptide-containing binding sites at different time points (modified from [8]).

