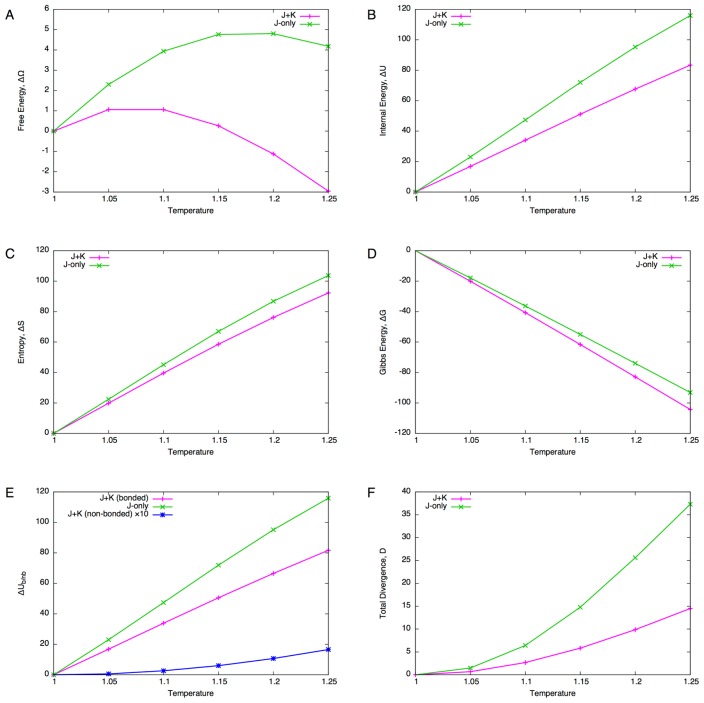
Figure 7.
Temperature scanning of the V-set domain. (A) Free energy difference ΔΩ from the reference state (T=1). (B) Internal energy difference ΔU. (C) Entropy difference ΔS. (D) Gibbs energy difference ΔG. (E) Decomposition of internal energy difference into bonded and non-bonded energy differences. The value of non-bonded energy difference (blue line) is multiplied by 10. (F) Total divergence of the core site compositions from the reference state (c.f., Eq. 70).

