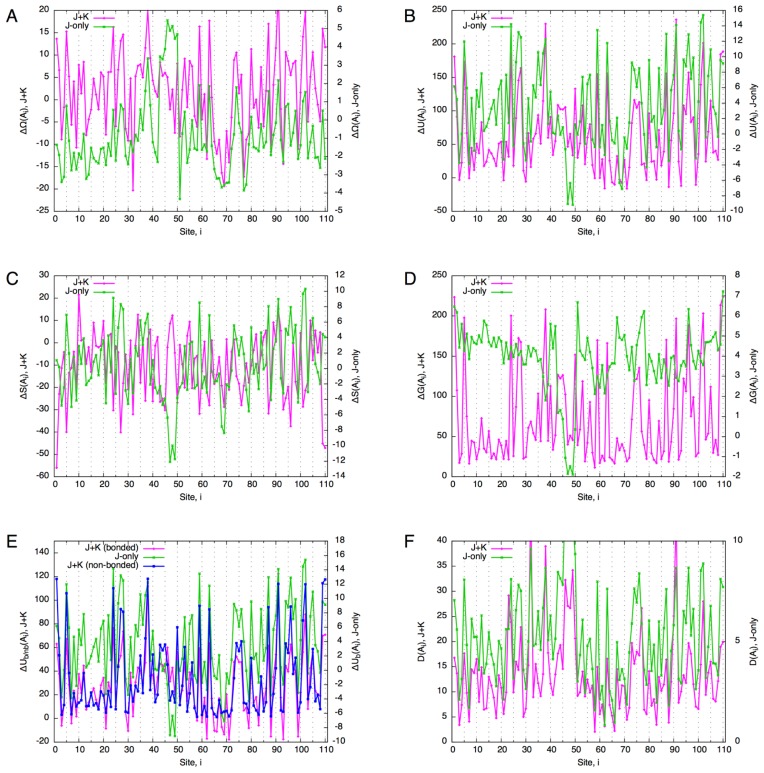
Figure 9.
“Alanine scanning” of the globin domain. The horizontal axis indicates the site at which the single-site density of a core site was set to 0.95 for alanine, and to 0.0025 for other residue types; the vertical axes indicate associated values (A)–(F), with the J+K system on the left axis, and J-only system on the right. (A) Free energy difference of “alanine point mutants” from the reference state. (B) Internal energy difference. (C) Entropy difference. (D) Gibbs energy difference. (E) Decomposed internal energy difference. (F) Total divergence of core sites (Eq. 70).

