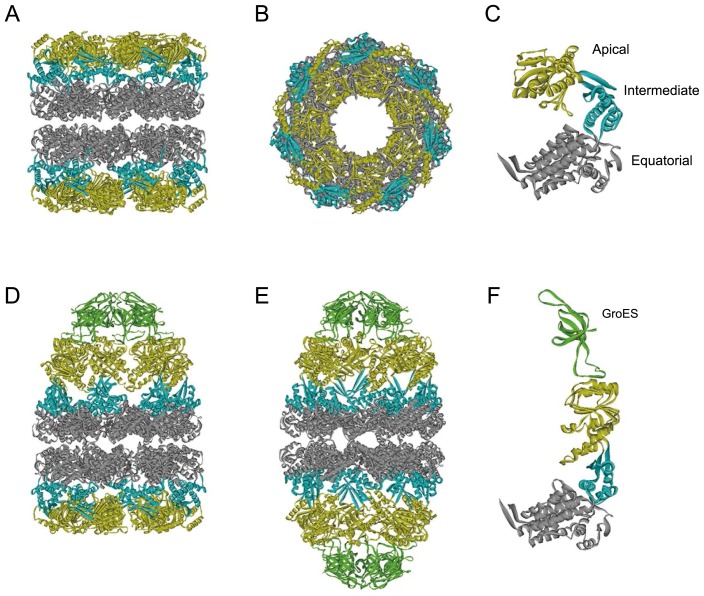
Figure 1.
Crystal structures of GroEL and GroEL-GroES complexes.
(A–C) Side (A) and top (B) views of GroEL tetradecamer and its subunit structure (C) [Protein Data Bank (PDB) code: 1GRL] [63]. The apical, intermediate, and equatorial domains are in yellow, blue, and gray, respectively. (D, E) Side views of an asymmetric GroEL–GroES complex (PDB code: 1AON) [12] and a symmetric GroEL–(GroES)2 complex (PDB code: 3WVL) [50]. (F) Subunit structure of GroEL in the GroES-bound ring (PDB code: 1AON). The GroES subunit is shown in green.

