
Figure 3.
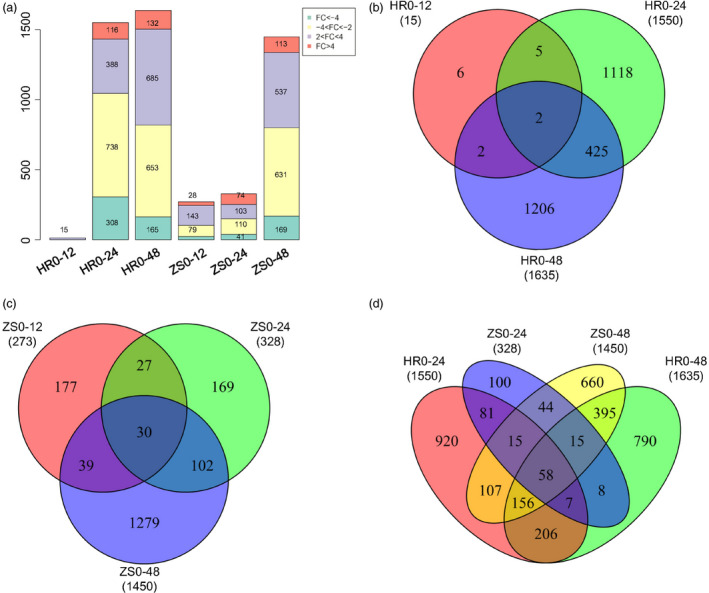
Expression dynamics change and comparative analysis of DEGs between the HR and ZS cultivars following whitefly infestation at different time points. (P < 0.01 and |log2(fold‐change)| > 2). (a) Number of transcripts exhibiting changes in expression in the HR and ZS cultivars following whitefly infestation. Fold change (FC) in expression calculated as log2 of the ratio of gene expression in cotton with (i.e. at 12, 24, or 48 h) and without whitefly infestation (i.e. 0 h). The values indicated in the boxes represent the number of DEGs at different time points in the HR and ZS cultivars. Venn diagram showing common or uniquely regulated genes at different time points in the whitefly‐infested HR cultivar (b) or ZS cultivar (c). (d) Cross‐comparison Venn diagram showing the number of constitutively expressed genes following whitefly infestation in the HR and ZS cultivars.