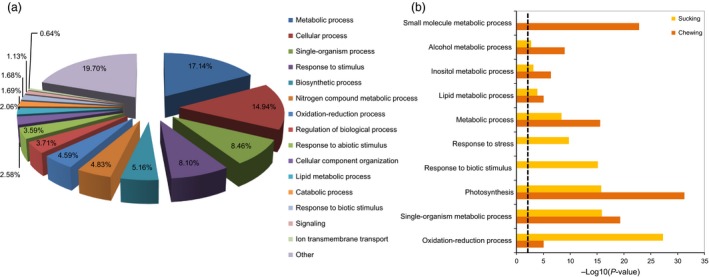
Figure 5.

Analysis of GO enrichments. (a) Functional classification of all DEGs following whitefly infestation in the HR and ZS cultivars. Pie chart represents differences in GO term enrichment. (b) Common and unique GO enrichments for various biosynthetic processes detected in cotton infested with phloem‐sucking or chewing insects (P < 0.01).
