Figure 6.

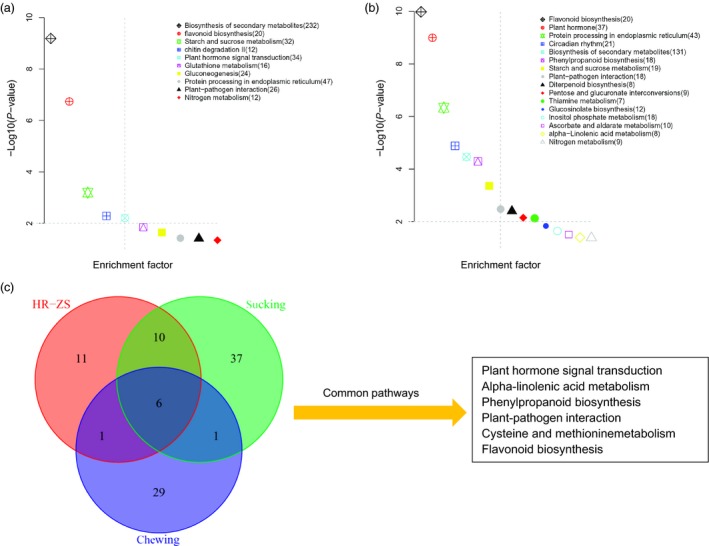
Distribution of KEGG pathways. Data were visualized using a scatter diagram of KOBAS2.0 results with P‐value levels indicated by “−log10 (P‐value)” and an enrichment factor indicative of individual pathways. Parentheses values in the figure legend represent the number of each pathway's components present in the DEG dataset. (a) Total number of DEG pathways in the HR cultivar. (b) Total number of DEG pathways in the ZS cultivar. (c) Ven diagram showing the overlap of common and unique pathways present in publically available transcriptomic datasets and transcriptome data from this study. The “chewing” dataset is for cotton flower buds infested by boll weevil larvae, whereas the “sucking” dataset is for cotton leaves infested with aphids and whiteflies. The most highly represented pathways (P < 0.01) are indicated to the right of the diagram.
