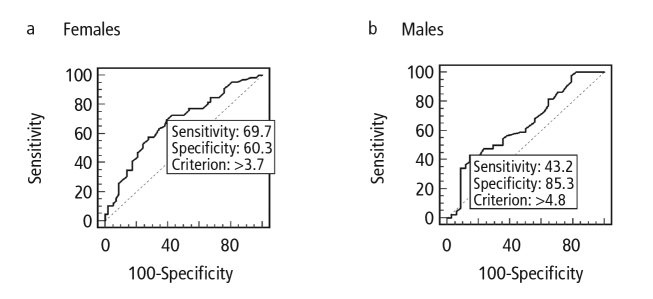
Figure 2.
a, b. ROC curve, obtained by plotting sensitivity for detecting SpA (y axis) against specificity (x axis). Healthy controls were used as the control group for determining specificity. ROC curve for entheseal thickness in females. Area under curve = 0.676 (a). ROC curve for entheseal thickness in males. Area under curve = 0.638 (b).

