
Figure 3.
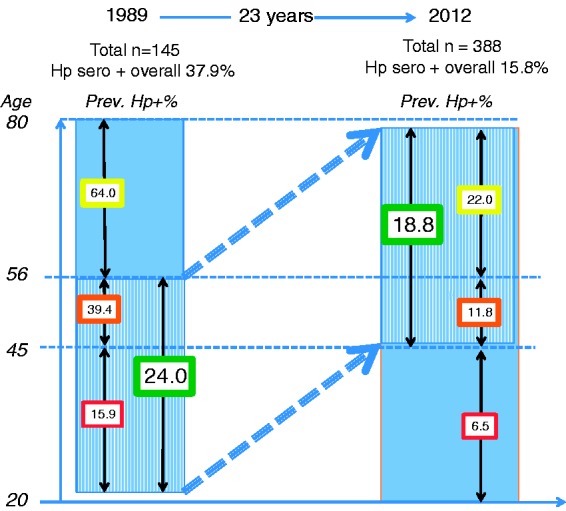
The prevalence (%) of positive Helicobacter pylori (H. pylori) serology in 1989 and 2012 in the three different age groups (20–44, 45–55, 56–80 years old), and the prevalence of positive H. pylori serology in bold figures in the green boxes for the corresponding age ranges 22–56 years in 1989 and 45–79 years 23 years later in 2012 (labelled ‘Aging group’ in Table 2).