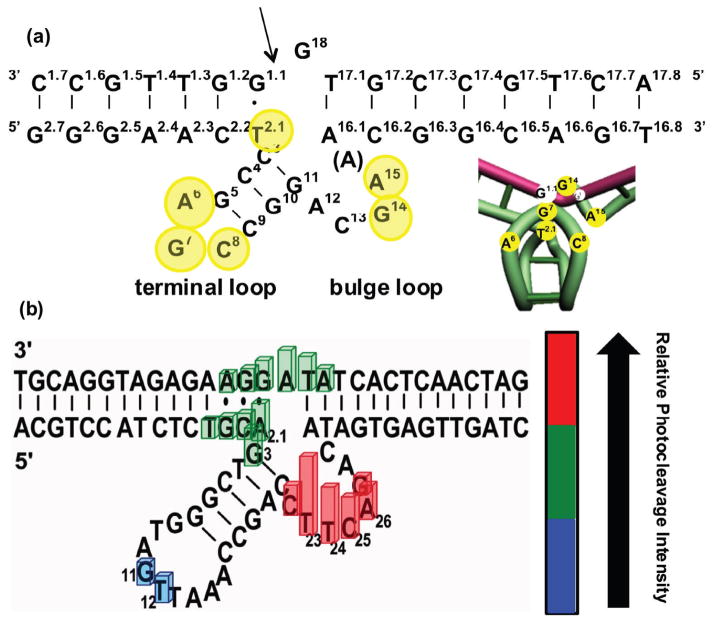
Figure 9.
Photocleavage and photocrosslinking analysis of DNAzyme structures, (a) Predicted secondary structure and model of three-dimensional structure of 8-17 DNAyzme produced by photocrosslinking analysis. The enzyme strand is shown in green and the substrate strand is shown in pink. Yellow and white circles indicate specific nucleotides. (b) Summary of the results of uranyl photocleavage studies of 39E DNAzyme. Bar heights are proportional to relative distance from uranyl. Colors show intensity of photocleavage: red (high), green (intermediate), and blue (low). Figure (a) is adapted with permission from ref 105, and figure (b) is adapted with permission from ref 108.

