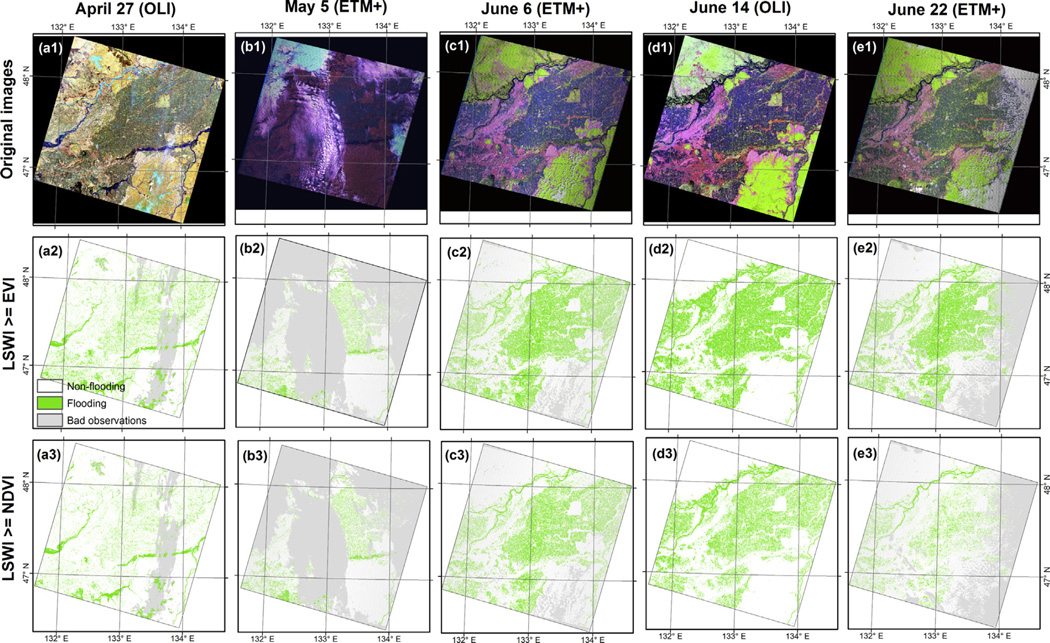
Fig. 10.
Spatio-temporal dynamics of flooded/open canopy for rice paddy fields identified from Landsat ETM+ and OLI images on April 27, May 5, June 6, June 14, and June 22 in 2013, respectively. Landsat images are false composite displayed with red (SWIR), green (NIR) and blue (red). (For interpretation of the references to colour in this figure legend, the reader is referred to the web version of this article.)

