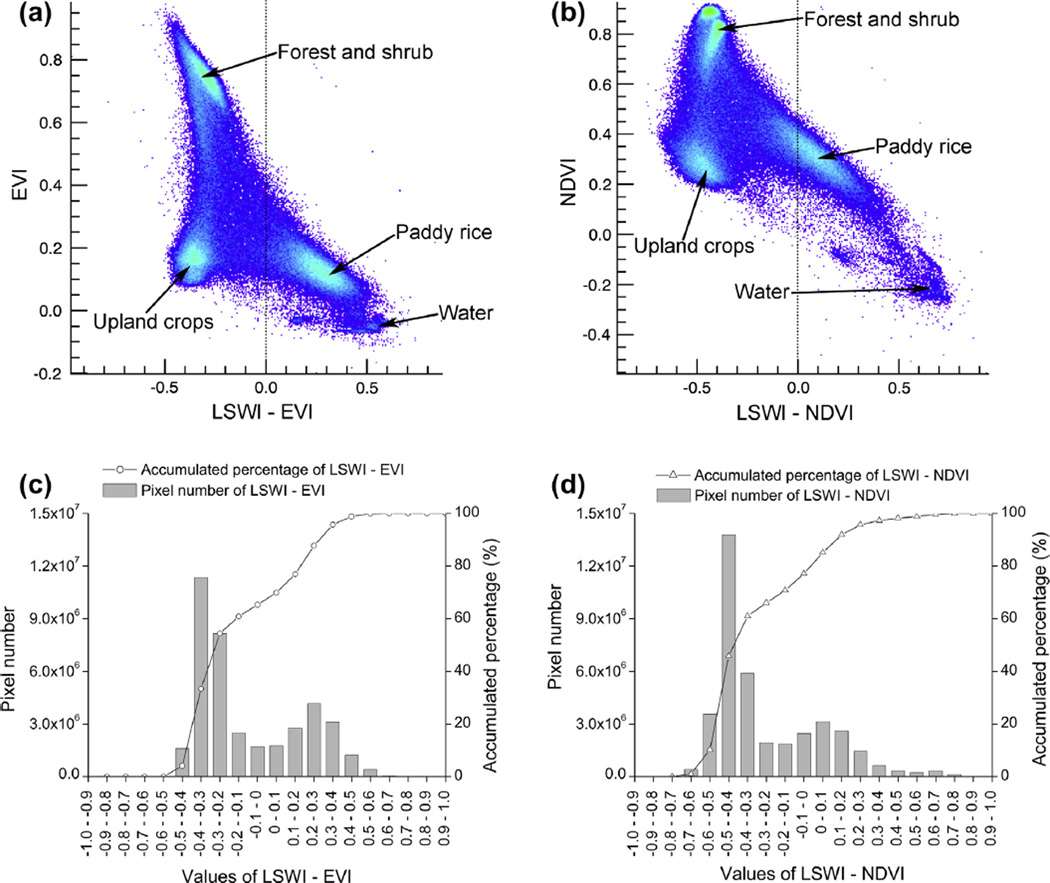
Fig. 9.
2-D scatter plots of vegetation indices and the difference between two vegetation indices from the Landsat OLI image on July 14, 2013: (a) LSWI-EVI and EVI, (b) LSWI-NDVI and NDVI, and the frequency distribution (pixel number) of (c) LSWI-EVI and (d) LSWI-NDVI. Color density represents numbers of pixels. (For interpretation of the references to colour in this figure legend, the reader is referred to the web version of this article.)

