
Figure 4.
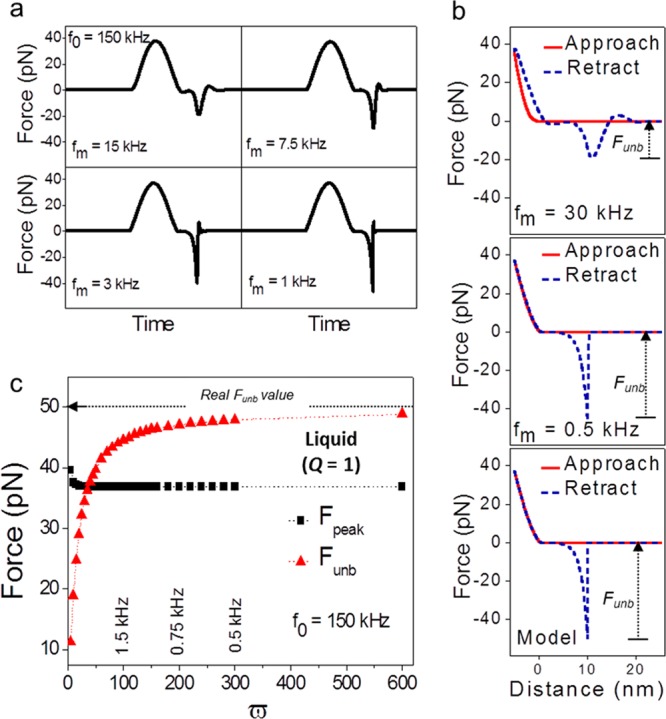
(a) Single-molecule force spectroscopy simulations. Time-varying forces for different distance modulation frequencies in a liquid. (b) Force curve reconstructed by using eq 1 for fm = 30 kHz (ϖ = 5) and fm = 0.5 kHz (ϖ = 300) and force curve of the model. (c) Dependence of the unbinding and peak forces on the frequency ratio for f0 = 150 kHz. Parameters of the interaction force and cantilever dynamics: Funb = 50 pN, β = 0.8 nm–1, D0 = 10 nm, a0 = 0.4 nm, Eeff = 1 MPa, k = 0.7 N/m, Q = 1, R = 5 nm, Am = 15 nm, zc = 10 nm.