
Figure 2.
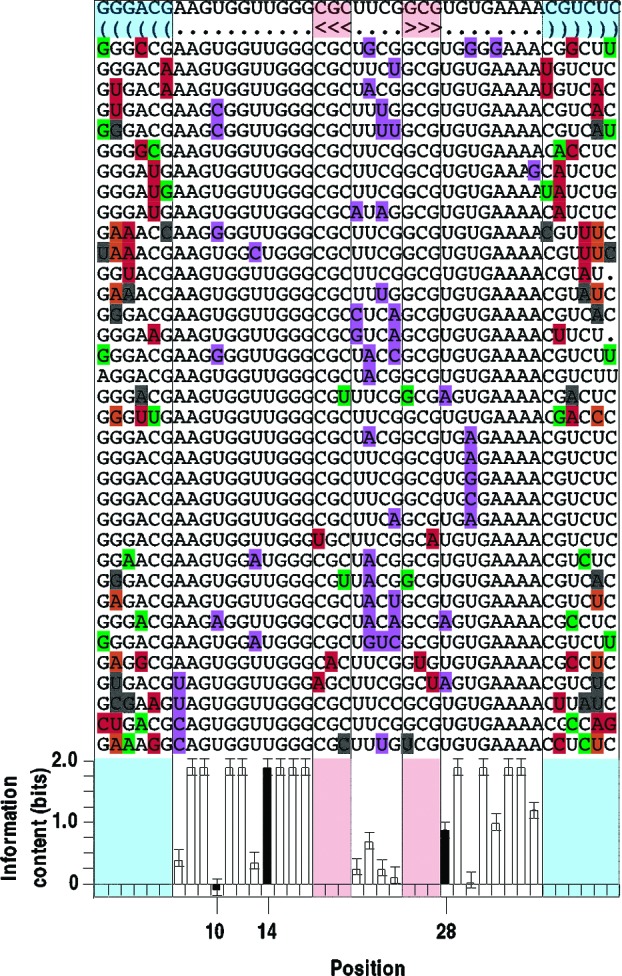
Example of selected sequence variants. The Class I-aptamer template was mutagenized 21% per position to search for functional sequence variants and is shown at the top. The secondary-structure model is shown in bracket form on the second line. Mutations in the stem regions are color-coded as follows: red, W−C covariation; orange, new W−C pairings; green, Wobble-pairings; black, broken base pairs. Mutations in the loop regions are marked in purple. The graph shows the information content calculated for each loop position; positions referred to in the text are shaded. Error bars show ± SD See Supporting Figure 1 for all eleven sets of selected alignments and Supporting Chart 1 for all original, minimized, and optimized sequences.