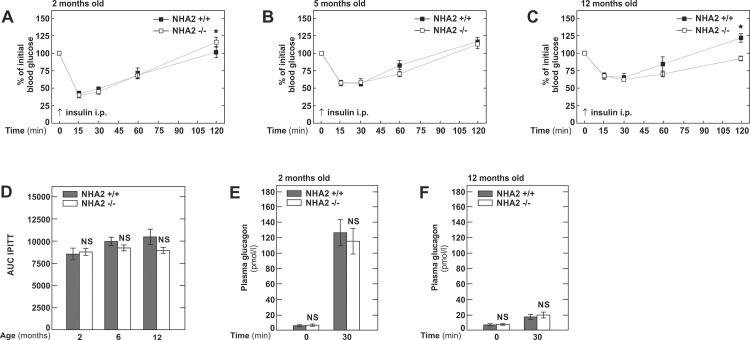
Fig 2. Intraperitoneal insulin tolerance tests in NHA2 WT and KO mice fed normal chow diet at different ages.
A) Blood glucose concentration in % of baseline glucose following ip. insulin challenge (1 U/kg body weight) at 2 months; n+/+ = 10, n-/- = 10. B) Blood glucose concentration in % of baseline glucose following ip. insulin challenge (1 U/kg body weight) at 5 months; n+/+ = 11, n-/- = 12. C) Blood glucose concentration in % of baseline glucose following ip. insulin challenge (1 U/kg body weight) at 12 months; n+/+ = 9, n-/- = 12. D) Area under the curve (AUC) of intraperitoneal insulin tolerance tests (IPITT) at 2, 6 and 12 months of age. E) Plasma glucagon concentration at baseline and 30 minutes after ip. administration of insulin (1 U/kg body weight) in 2 months old mice. F) Plasma glucagon concentration at baseline and 30 minutes after ip. administration of insulin (1 U/kg body weight) in 12 months old mice. Data are mean values ± SEM, (* p<0.05, WT vs KO; NS = not significant, WT vs KO).

