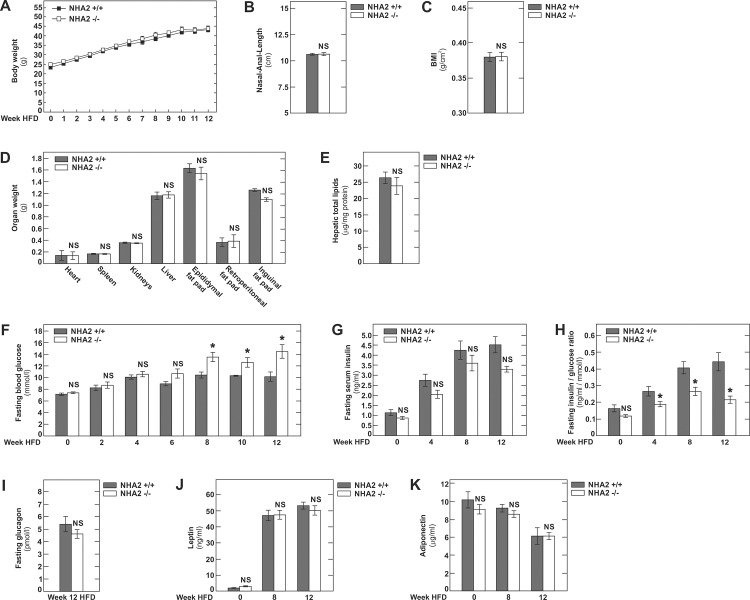
Fig 3. High fat diet in NHA2 WT and KO mice.
A) Weight gain of mice during 12 weeks of HFD. HFD was started at 8 weeks of age. B) Nasal to anal length at week 12 of HFD. C) BMI at week 12 of HFD. D) Organ and fat pad weights at week 12 of HFD. E) Hepatic total lipid content at week 12 of HFD. F) Fasting blood glucose concentration at baseline and at indicated week during HFD. G) Fasting serum insulin concentration at baseline and at indicated week during HFD. H) Fasting insulin to glucose ratios at indicated time points during HFD. I) Fasting plasma glucagon concentrations at week 12 of HFD. J) Fasting serum leptin concentrations at baseline and at indicated week of HFD. K) Fasting serum adiponectin concentrations at baseline and at indicated week of HFD. Data are mean values ± SEM, (* p<0.05, WT vs KO; NS = not significant, WT vs KO).

