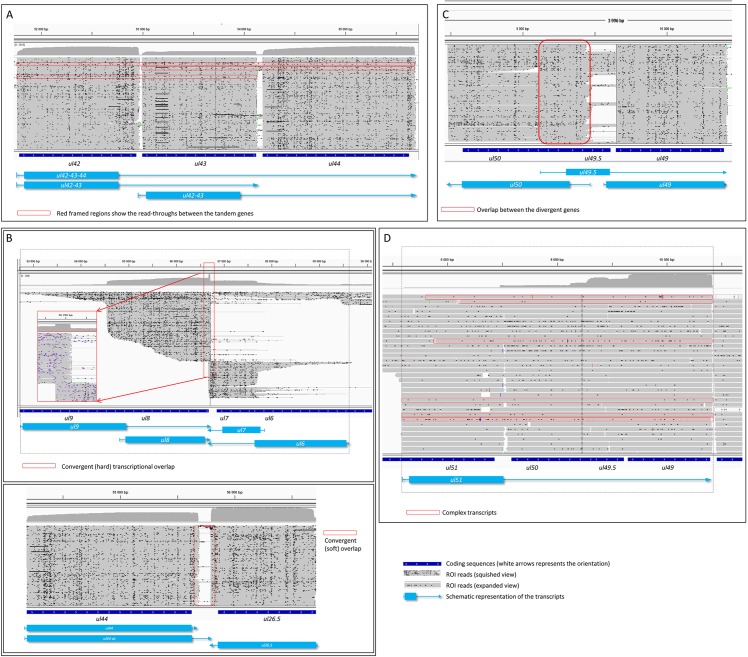
Fig 6. Extensive overlaps between PRV transcripts.
Transcriptional overlaps between adjacent (A: parallel; B: convergent “hard” and “soft”; C: divergent) and distal (D) genes. Figures represent the ROIs and the coverage of reads across certain genomic regions. The overlapping transcripts are shown at the bottom of the figures. A, B and C figures illustrate the squished view of the ROIs, while panel D shows the expanded view of the reads.

