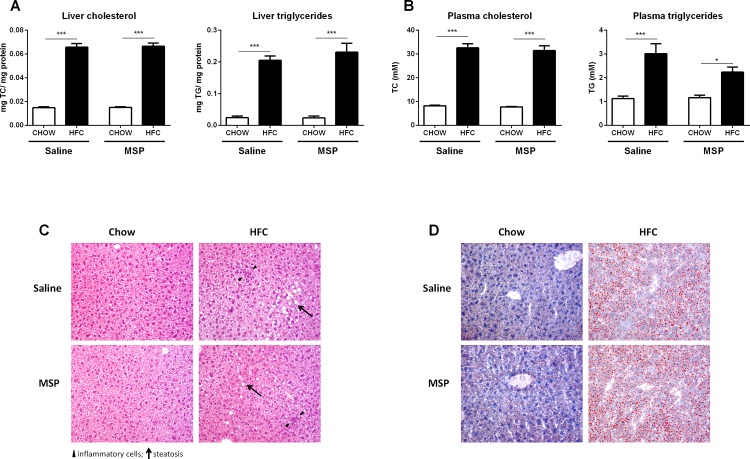
Fig 2. Liver and plasma lipid levels.
(A) Hepatic levels of total cholesterol (TC) and total triglycerides (TG) after one week of regular chow or HFC diet in Ldlr-/- mice, with and without MSP treatment. (B) Plasma TC and TG levels. (C,D) Representative images (200x magnification) of the H&E staining and Oil Red O staining of liver sections. Data are represented as mean ± SEM. * and *** indicate significant differences between groups, with * p≤0.05 and *** p<0.001.

