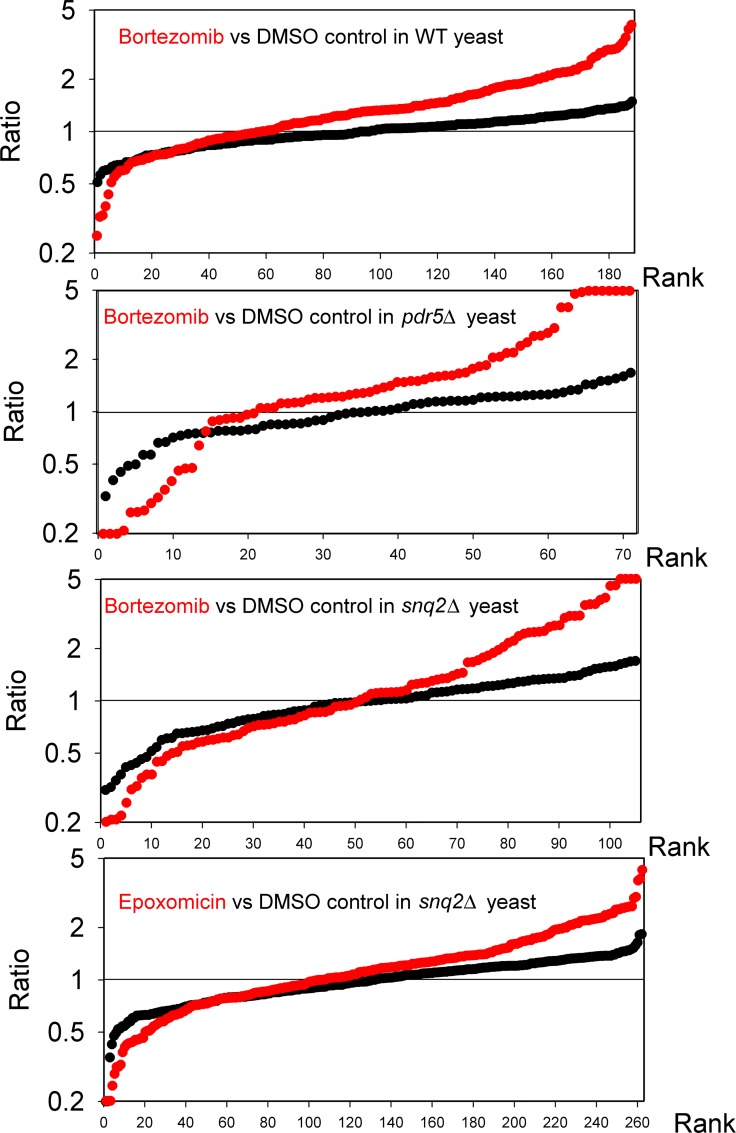
Fig 3. Effect of bortezomib or epoxomicin on relative levels of peptides in yeast.
Wild type yeast (top panel) or yeast deleted for drug transporter genes PDR5 (second panel) or SNQ2 (bottom two panels) were treated with proteasome inhibitors for 1 hour and then processed for peptidomics as described in Materials and Methods. See S1 Fig for labeling scheme used for quantitative peptidomics. Wild-type yeast were treated with 1 μM bortezomib, the pdr5Δ and snq2Δ strains were treated with 10 μM bortezomib, the snq2Δ strain was treated with 4 μM epoxomicin and control replicates were treated with a comparable amount of drug vehicle alone (maximum 0.1% DMSO). Each replicate was compared to the average level of that peptide in the control replicates and the individual ratios sorted by rank and plotted. The y-axis represents the relative level of each replicate, comparing either drug-treated to the average control values (red) or the control replicates to the average control values (black). See S5 Table for relative peptide levels of each peptide in the various treatments.

