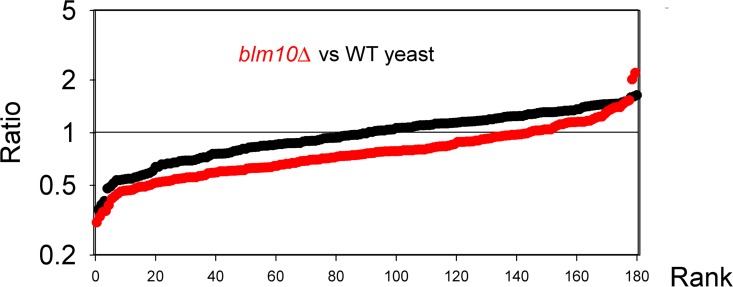
Fig 5. Comparison of peptide levels in wild-type and BLM10 gene deletion yeast strains.
Each replicate was plotted as described for Fig 3. See S1 Fig for labeling scheme and S5 Table for quantitative data on each individual peptide. Although there was a slight decrease in the relative level of most peptides in the blm10Δ strain (red) compared to the wild-type strain (black), based on the range of values for the replicates, these changes were not statistically significant.

