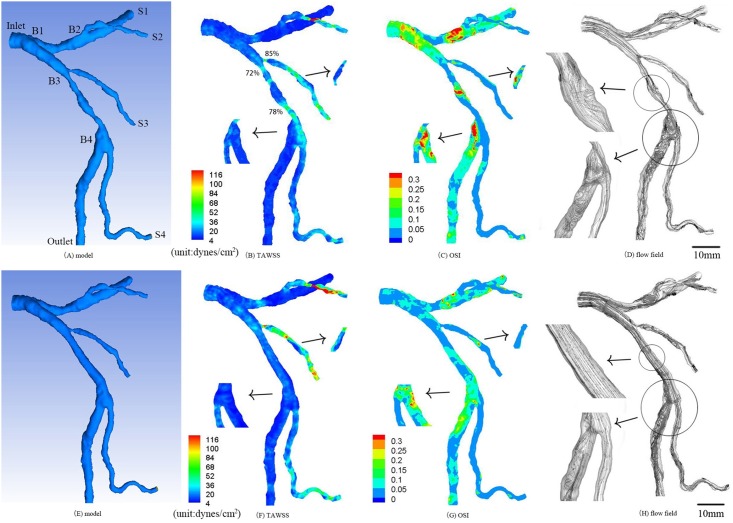
Fig 2. (A-D) Geometrical model reconstructed from CTA (A), TAWSS (B), OSI (C) and flow field (D) in the epicardial LMCA tree of a representative patient who has area stenosis of 72% and stenotic length of 8.1 mm, area stenosis of 78% and stenotic length of 7.9 mm, area stenosis of 85% and stenotic length of 2.4 mm at three sites; (E-H) geometrical model (E), TAWSS (F), OSI (G) and flow field (H) in the epicardial LMCA tree after suppositional angioplasty (i.e., two area stenoses in the main trunk of epicardial LAD tree were assumed to be restored after angioplasty).
The small figures for TAWSS and OSI show the posterior view. The small figures for flow field show the zoomed view.

