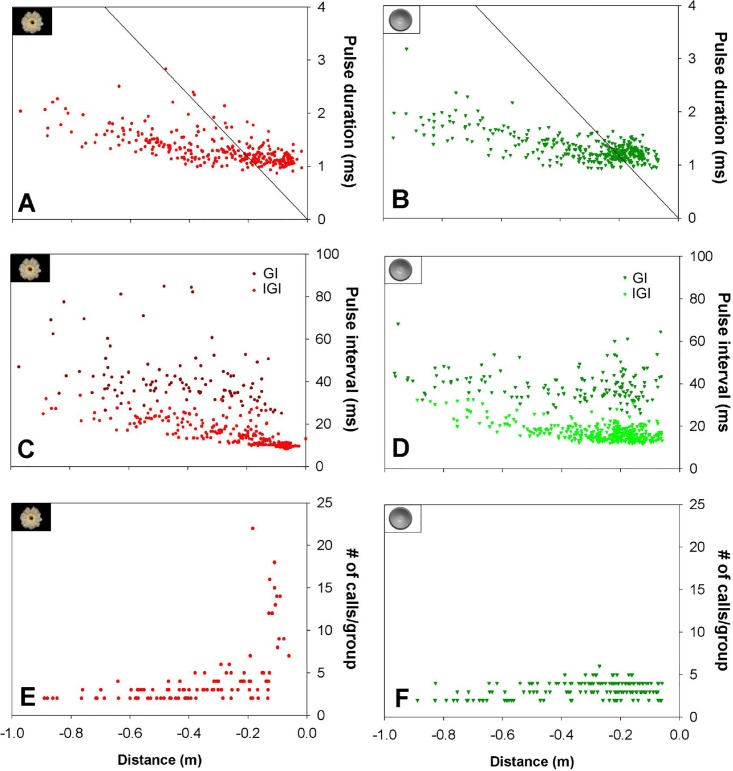
Fig 4.
Pulse duration (A and B), pulse interval (D and C) and number of calls per group (E and F) of all calls recorded from bats approaching cactus flower and hemisphere. The line represents the beginning of the overlap zone and all calls located to the right of this line overlap with their echo. Pulse interval data are divided in inter-group interval (GI, higher values) and inter-pulse interval (IGI, smaller values). E and F represent the number of calls emitted per group while the bats approach to the targets; the plotted distance is the first call of each group.

