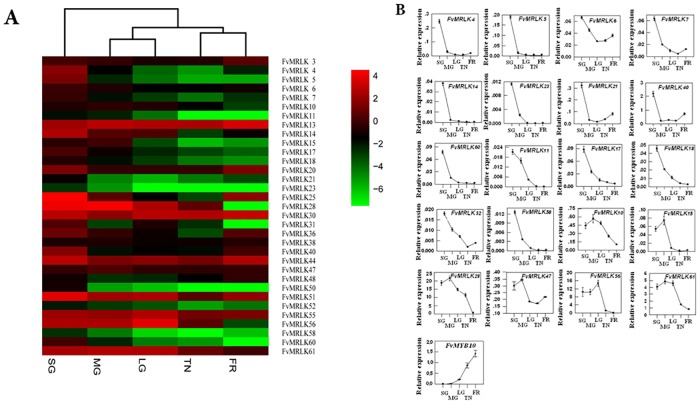
Fig 6. Changes in the expression profiles of FvMRLK genes during strawberry fruit growth and development.
(a) Heat map showing the expression profiles of the FvMRLK genes. The heat map was generated based on the mean values of the qRT-PCR data of the different samples. Red and green colors represent higher or lower expression. (b) Expression of the FvMRLKs decreased during strawberry fruit growth and development. The data are the mean of 3 replicates ±SE.

