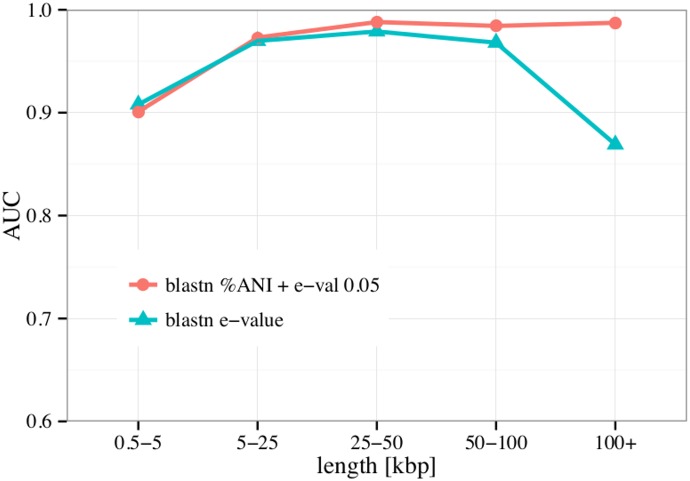
Fig 2. Performance according to sequence length.
The performances measured in AUC for %ANI classification and top-hit e-value classification are compared. Data are binned according to sequence length and performance is shown separately for each bin. Note that the amount of sequences in each bin differs but the amount of positive and negative examples is always comparable.

