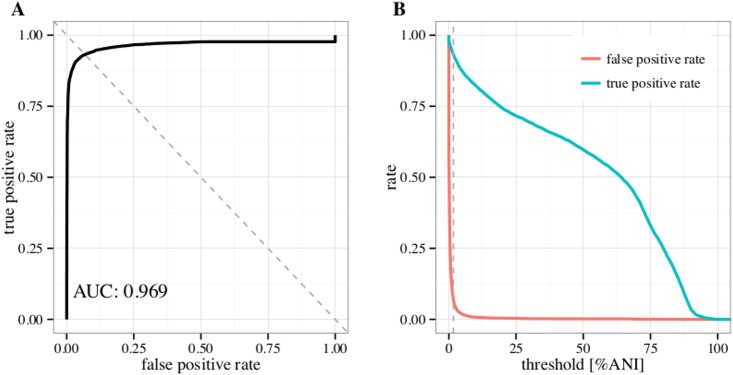
Fig 4. MetaPhinder performance curves.
(A) ROC curve intersected by the dashed line used to select the classificaction threshold. (B) True positive rate and false positive rate compared for different classification thresholds (in %ANI to the whole phage database). The vertical dashed line indicates the selected classification threshold.

