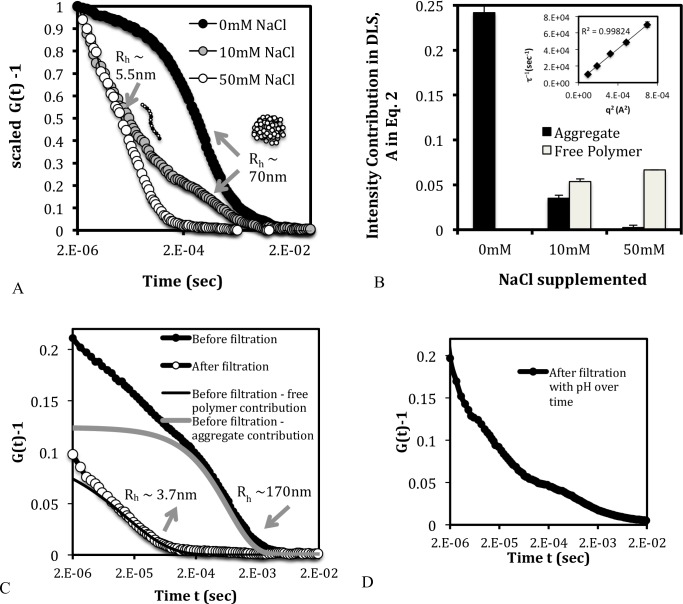
Fig 3. Distribution of the aggregated and free polymer species at PEI dissolution and with addition of NaCl.
(A) Scaled DLS correlation data showing the predominance of the aggregate form in the absence of NaCl, and the gradual release of free polymer with the addition of salt. The arrows point to the hydrodynamic diameters corresponding to the decay region of the DLS curve. (B) Unscaled intensity contribution showing that the aggregate form releases free polymers as salt is added to the solution. (C) DLS correlation curve showing that filtration removes the contribution from the aggregate form, indicating that the latter is a separable entity. (D) DLS correlation curve of the solution from C over time with the addition of HCL in this case, showing the return of the aggregate contribution. The data in C and D are shown for 2.72 mM PEI and 50 mM NaCl.

