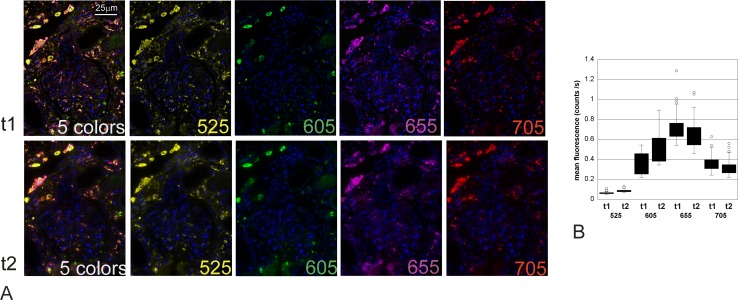
Fig 1. Stability of 5 color immunofluorescence performed with original Qdots: TNFα 525 (yellow), CCR2 605 (green), MHCII 655 (purple), CD68 705 (red) & Qnuclear red (blue), mounted in Qmount and captured 27 months apart.
A: unmixed images for each fluorophore and combined 5-colour images at the time of staining (t1) and 27 months later (t2). The cubes were captured (500nm to 720 nm) and unmixed using Nuance. The images shown are false colour images viewed with Clip/Stretch; mapping the lowest 0.01% of the pixels to 0, the highest 0.01% to 255, and linearly interpolating in between. The contrast has been increased 14% in all the photos for more representative printing. No other alterations were performed. The intensity of fluorescence of positive cells for each marker was analysed with the Nuance software and compared between the 2 time points. There was no significant difference in the fluorescence intensity of any marker photographed 27 months apart (p = 0.223, ANOVA). B: Box plot of the mean fluorescence intensity of each fluorophore in the cells of interest (ie thresholded for positivity with the marker labelled by Qdot 525) on the initial image (t1) and after 27 months (t2).

