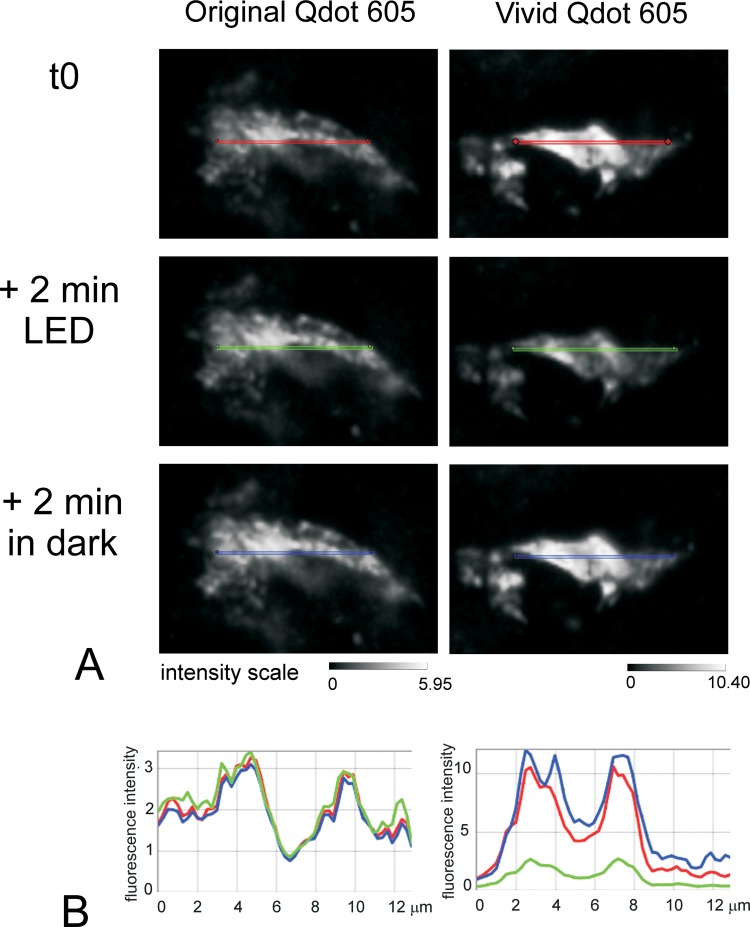
Fig 2. Quenching of Vivid but not original Qdots under LED fluorescence illumination.
FFPE serial liver sections were labelled for the marker CD68 using a Labelled StrepAvidin Biotin (LSAB) method with either original streptavidin conjugated Qdot605 or streptavidin conjugated Vivid Qdot605. Fig 2A shows the intensity of fluorescence for one representative cell stained with either the original Qdot (left) or the Vivid Qdot (right): t0 represents the initial capture of the image; the sections were then left under constant illumination with LED 425nm for 2 minutes and finally left for a further 2 minutes in the dark. Note the difference in the intensity scale 0–5.95 for Original Qdot and 0–10.40 for Vivid Qdot. Fig 2B: Intensity profile along the line drawn on each image. Line profiles were drawn on the initial images (t0) using the Nuance software and copied onto the other images. For both original (left) and Vivid Qdot605 (right), the line profile intensities are given scaled to max (red lines: initial intensity; green lines: after 2 minutes illumination with LED 325nm, blue after a further 2 minutes in the dark). The scale is given by the lines which all are 13 μm in length.

