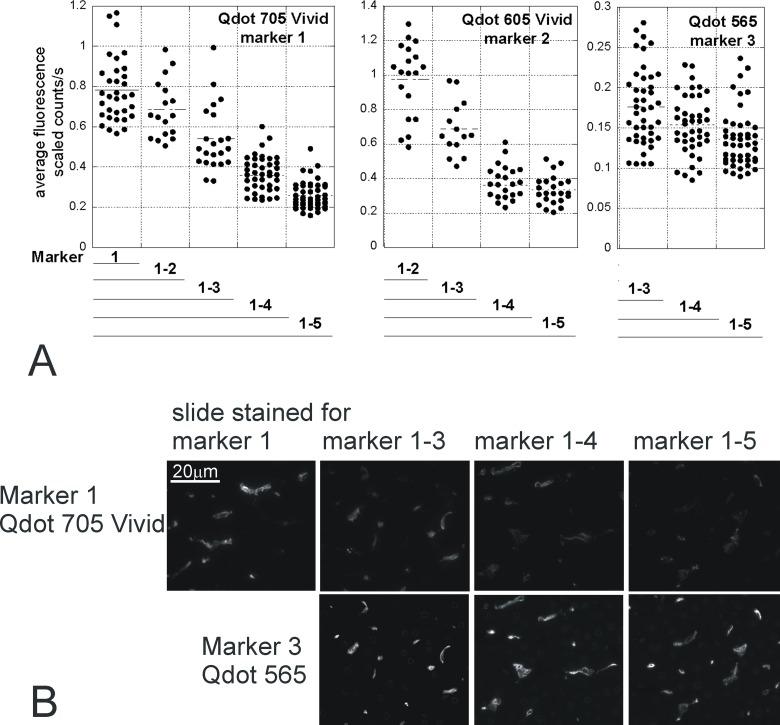
Fig 6. Decreased immunofluorescence during multiplex staining.
Serial sections were stained with 1 to 5 different markers (Marker 1, MHCII Qdot 705Vivid; Marker 2, HO1 Qdot 605Vivid; Marker 3, CD163 Qdot 565; Marker 4, CD206 Qdot 655Vivid; Marker 5, CD68 streptavidin Qdot 525). After each staining round, a slide was mounted and imaged. Analysis of the intensity of Qdots 705Vivid, 605Vivid and 565 fluorescence is shown (Qdot 655Vivid & 525 in S3 Fig) for one representative field (aligned in serial sections). Each dot corresponds to one thresholded positive cell. The intensity of fluorescence is affected by the number of staining rounds (p<0.001, ANOVA) and the Qdot type (p<0.001, ANOVA): intensity decreases with the incremental number of subsequent staining rounds, and the reduction is greater for Vivid than original Qdots, (fitted linear regression slopes for absolute and (in brackets) relative brightness change with each additional staining round: -0.02 (-0.11) for Qdot 565; -0.22 (-0.23) for Qdot 605Vivid; -0.14 (-0.17) for Qdot 705Vivid). B: representative images showing the fast decrease of Qdot 705Vivid intensity, and the lesser decrease of Qdot 565 with the number of successive stainings. The Qdot 565 staining on slide 1–5 underwent the same treatments as Qdot 705Vivid on slide 1–3 ie 2 extra rounds of staining. All 705 images are scaled 0–2.2 while 565 images are scaled 0–0.5 (according to the range of fluorescence intensity after initial labelling with each Qdot).

