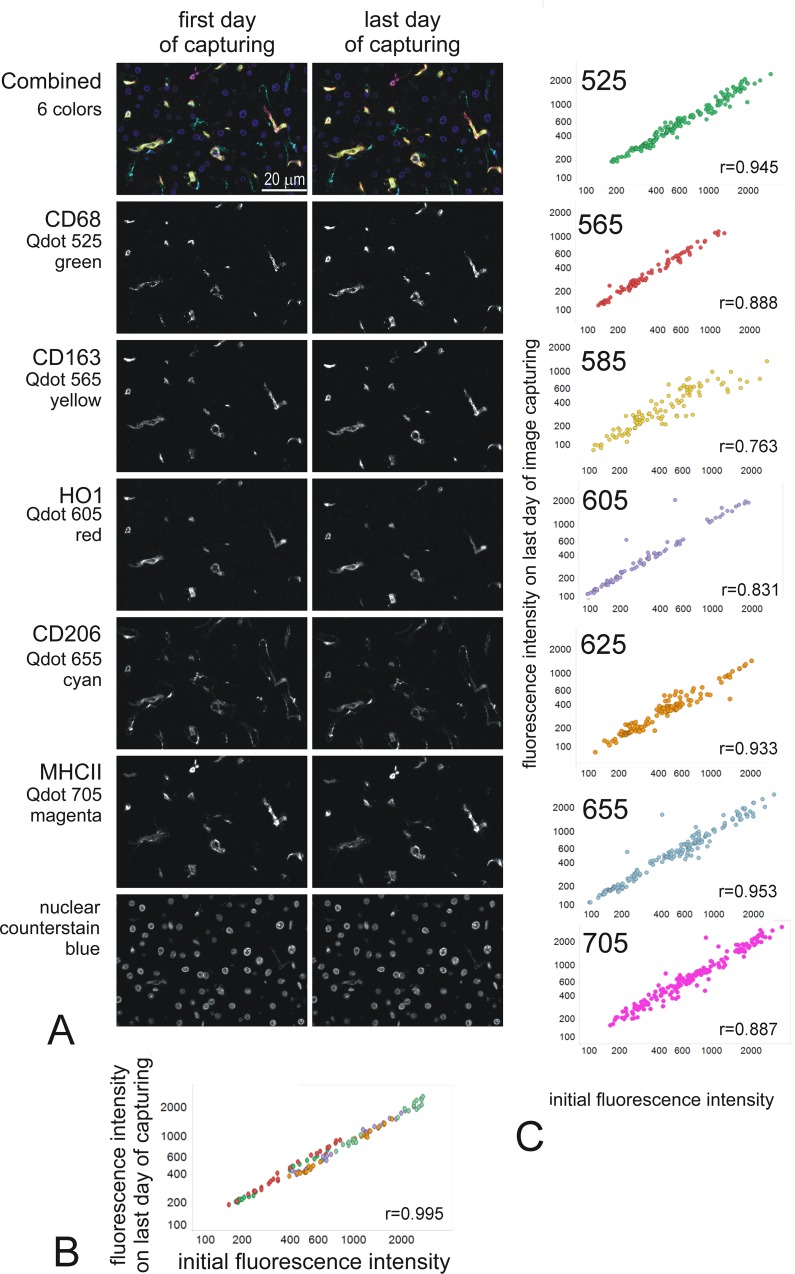
Fig 9. Reproducible stability of Qdot fluorescence in multiplex immunofluorescence.
A: representative images (about 1/8 of the actual captured images) of a 7 colors staining taken on the day of staining and on the last day of image capturing of the experiment (day 4 for the example shown). The markers and Qdots used are indicated on the left of the images. The fields were matched as closely as possible. The images shown are intensity images spectrally unmixed with Nuance, at the same scale on first and last day of capturing. The top 2 images are combined images for all 6 makers, with false color as indicated under each marker. B: plot showing the intensity of fluorescence on the initial (x-axis) versus the last (y-axis) day of capturing (day 4) (16 x20 fields; intensity in counts/s). The linearity confirms the stability of the staining, (Pearson coefficient r = 0.095 p<0.001). C: Stability plot for the indicated Qdots used in 11 6-colour multiplex experiments. Data is expressed as mean fluorescence intensities (counts/s) per microscope field, analysed initially (D0) and various days later. All data were analysed by the same operator, using AxioVision and manual thresholding for a cell-specific marker to define the cells of interest. The plots show correlations between the initial intensity and the final intensity for 6 Qdots pooled from 11 different staining batches. The specific fluorescence intensity did not change significantly with time (daily to 5 days after initial staining) compared with the initial measured intensity for all Q dots taken together (Pearson coefficient “r” is indicated for each Qdot all with p<0.001).

