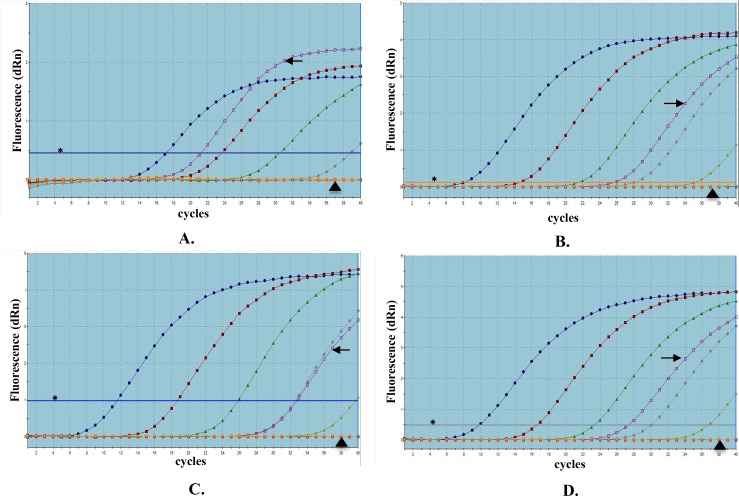
Fig 2. Amplification plots of BamHI-W DNA and three BART-miRNAs extracted from cell lines, by real-time qPCR.
(A) BamHI-W DNA; (B) miR-BART2-5p; (C) miR-BART17-5p; and (D) miR-BART18-5p. Jijoye is a latency type III Epstein-Barr virus-positive Burkitt’s lymphoma cell line, and BL2 is an EBV-negative Burkitt’s lymphoma cell line. Standard curves are expressed with blue, red, green, grey, and yellow lines using 100-fold serial dilutions of plasmid or cDNA derived from BART-miRNA mimics. Each amplication plot of Jijoye and BL2 is expressed with purple and orange lines. A horizontal line indicated with an asterisk (✱) shows the threshold fluorescence based on each standard curve. Amplification plots of Jijoye and BL2 cell lines are indicated with an arrow (➜) and arrowhead (▲), respectively. Each EBV-related factor was detected only in the positive control, Jijoye, and not in the negative control, BL2.

