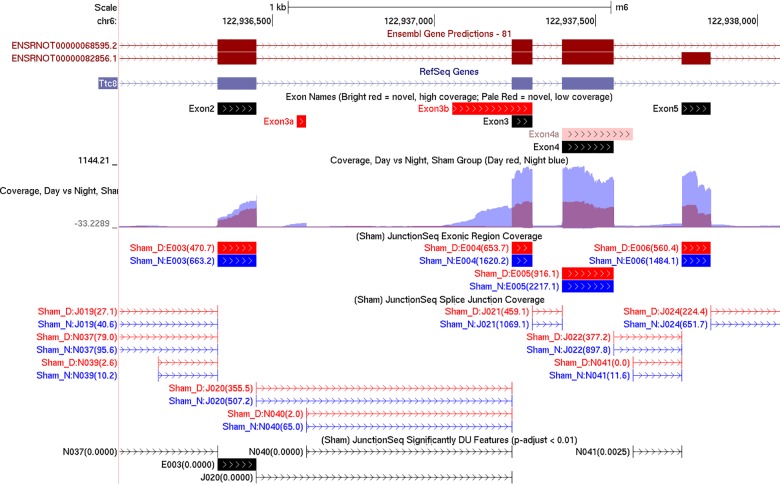
Fig 2. Summary browser tracks generated by QoRTs/JunctionSeq for the region surrounding exons 2 to 5 of Ttc8.
The top two tracks display the Ensembl and RefSeq annotations, respectively. The third track displays the names of the exons as they are referred to in the text and in previous literature, with our own names assigned to previously-unidentified exons. The fourth track, generated by QoRTs, displays the mean normalized read-pair coverage depth at each genomic position for night (blue) and day (red) in the sham group. The fifth and sixth tracks, generated by JunctionSeq, display the mean normalized read counts across each known exonic region and across each splice junction (respectively). The bottom track, also generated by JunctionSeq, displays the exons or splice junctions found to display statistically significant differential usage (at p-adjust < 0.01).

