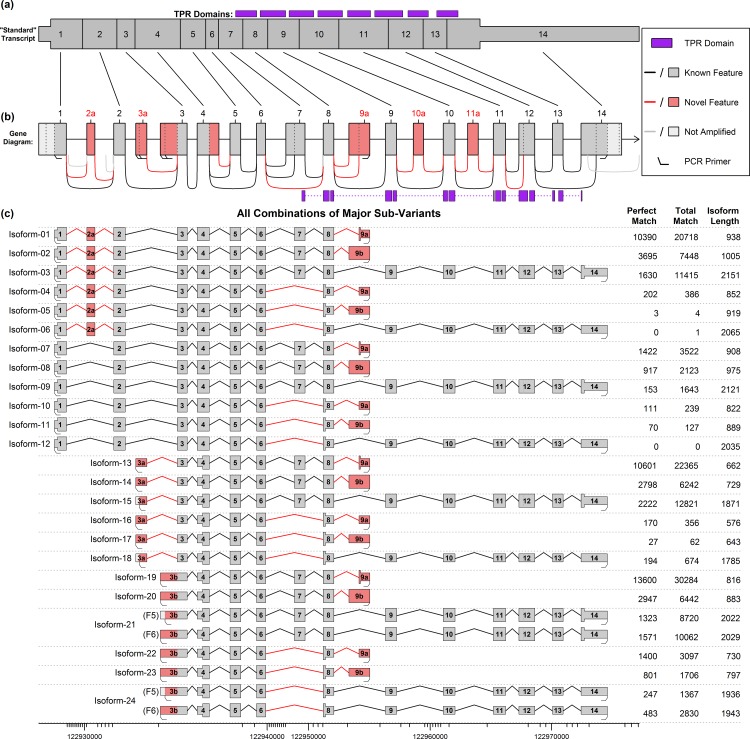
Fig 4. Diagram of the 24 potential isoforms produced by the “major” sub-variants, with PacBio match counts.
Part (a) and (b) display the “standard” known isoform and a diagram of the whole gene, respectively. The wide portion of (a) indicates the coding DNA sequence (CDS) of the “standard” transcript, and the purple boxes in (a) and (b) indicate tetratricopeptide repeat (TPR) domains. Part (c) displays the 24 possible combinations formed by the “major” sub-variants from Fig 3. Novel features are displayed in pink, and the widened region in each transcript denotes the largest open reading frame (ORF). The data table on the right side of (c) displays the number of full-length ROI from the SMRT sequencing that were found to match each isoform. The first column indicates the number of perfect, base-for-base, full-length matches, and the second column lists “alignment matches”, in which the RNA-STAR aligner maps the ROI to the isoform. Note that the novel start sites were each covered by two primers that were less than 6 base-pairs apart, producing slightly different amplified molecules. Isoforms 21 and 24 were covered by two different primer pairs used in the PCR amplification. See S3 Dataset for more information on these theoretical isoforms and their PacBio coverage.

