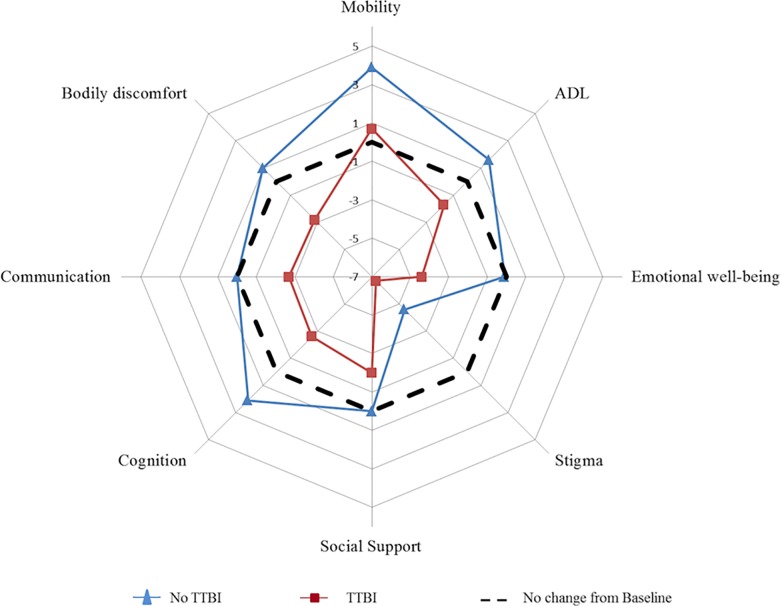
Fig 2. Evaluation of the change in PDQ-39 score between the baseline and at 12 months in the two groups of PD patients.
The spider chart shows the difference in each PDQ-39 dimension between the baseline and at 12 months. The dotted line indicates an absence of change in the PDQ-39 score over the 12-month period. Quality of life improved when the point plotted is below the dotted line and worsened when it is above the dotted line.

