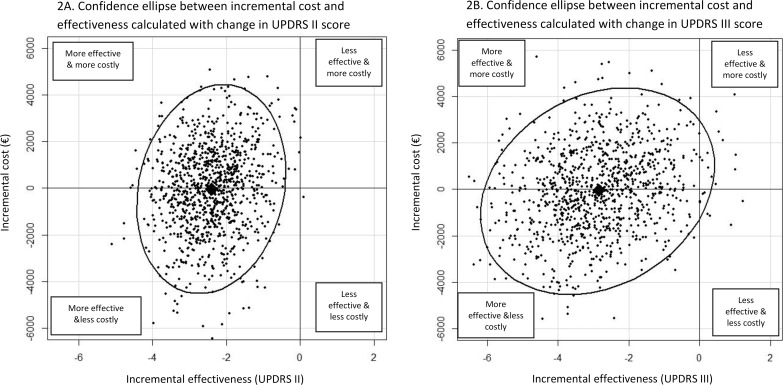
Fig 3. 95% credible region of the ICER using the confidence ellipse method.
These figures show the cost-effectiveness plane for therapeutic education in PD compared to conventional care based on 1000 bootstrap estimates of the difference in cost and effectiveness. Incremental effectiveness and incremental cost are plotted on the horizontal and vertical axes, respectively. Each dot represents the ICER for one simulation. Lozenges represent the observed ICER. Ellipses represent a 95% confidence region around the ICER for the therapeutic education strategy compared to conventional care. Most of the dots are found in the left areas, showing that therapeutic education is cost-effective (more effective and more costly) or cost saving (more effective and less costly).

