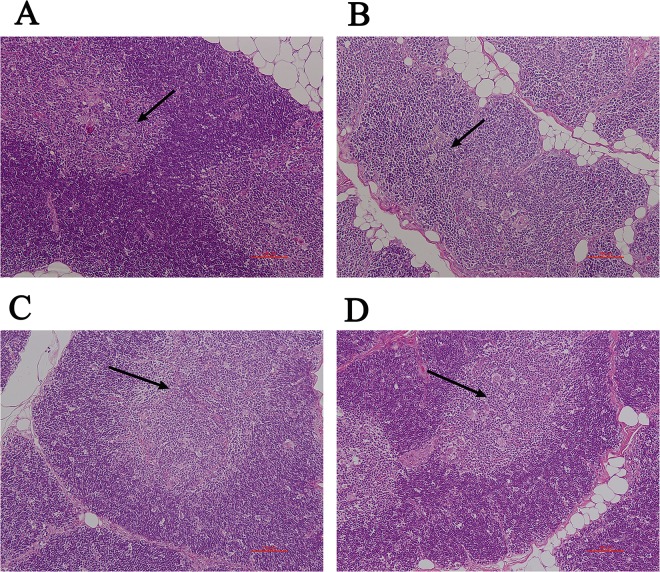
Fig 3. Microscopic evaluation of the thymus of monkeys fed on diets containing GM rice or non-GM rice (Stained with HE, 100×).
Microscopic evaluation of the thymus (100×) in monkeys in the non-GM rice group (A), positive control group (B), 17.5% genetically modified rice (GM rice) group (C), 70% GM rice group (D). Thymus glands of monkeys in the positive group (B) show atrophy and moderately fewer lymphocytes in the cortex and medulla.

