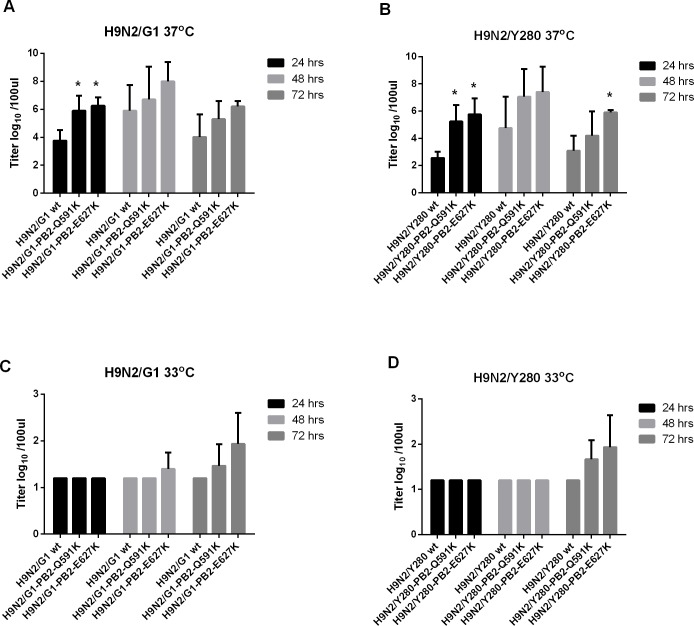
Fig 2. Virus replication of primary NHBE cells infected by H9N2 viruses.
Primary NHBE cells were infected at MOI of 2 with H9N2/G1 or H9N2/Y280 and their PB2 variants. The virus titers were measured from the supernatant of 24, 48 and 72 hours post-infection by TCID50 assay. (A) H9N2/G1, 37oC (B) H9N2/Y280, 37oC (C) H9N2/G1, 33oC (D) H9N2/Y280, 33oC. The data is shown by the results of the mean value of three independent experiments. *: p<0.05

