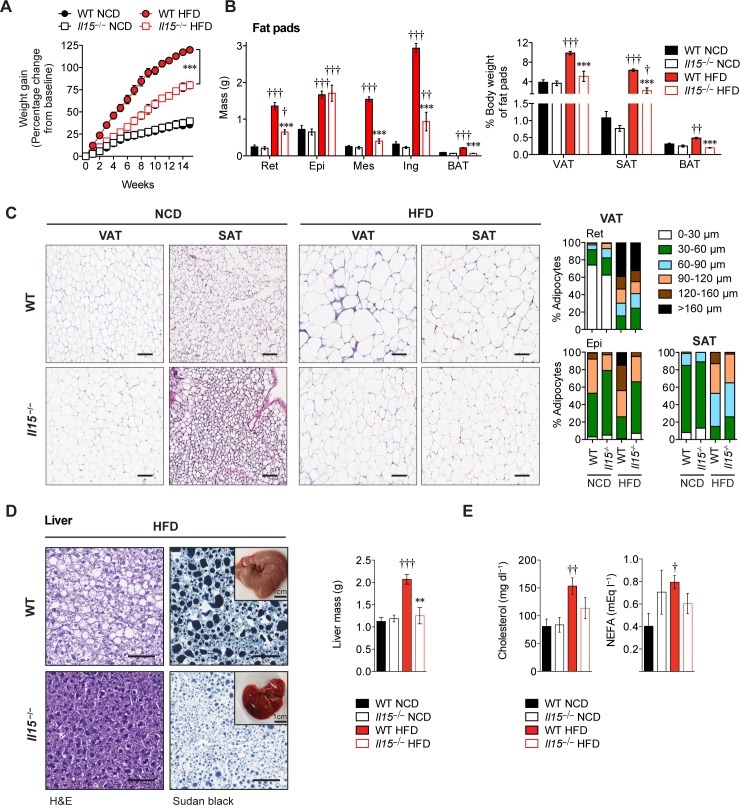
Fig 1. Ablation of Il15 protects from diet-induced weight gain.
(A) Gain in body weight of WT and Il15−/− male mice fed either NCD or HFD for 16 weeks from 4 weeks of age (mean ± SEM; n = 5–11 from 2–3 independent experiments; ***p<0.001). (B) Mass of retroperitoneal (Ret), epididymal (Epi), mesenteric (Mes), inguinal (Ing), and interscapular BAT (mean ±SEM; n = 5–11; ***p<0.001 vs WT, ††p<0.01, †††p≦0.0001 vs NCD; left). Mass of pooled VAT (Ret, Epi and Mes), SAT (Ing) and BAT is shown as percentage of body weight (mean±SEM; n = 5–8; ***p≦0.0001 vs WT, †p<0.05, ††p<0.01, †††p<0.001 vs NCD; right). (C) H&E stained-sections of VAT (Ret) and SAT (Ing). Scale bar = 100μm. Magnification ×10. Adipocyte size distribution (cross-sectional diameter in μm; between 800–1500 adipocytes per group). (D) H&E and Sudan Black (for triglycerides and lipids) stained-sections of liver. Scale bar = 100μm. Magnification ×20. Representative macroscopic pictures of the livers are shown in the inset. Liver mass (right) of WT and Il15−/− male mice maintained on NCD HFD (mean±SEM; n = 5–8; **p<0.01, vs WT, †††p<0.001 vs NCD. (E) NEFA and cholesterol levels were measured in the sera of WT and Il15−/− male mice maintained on NCD HFD (mean ± SEM; n = 3–7; †p<0.05, ††p<0.01 vs NCD).

