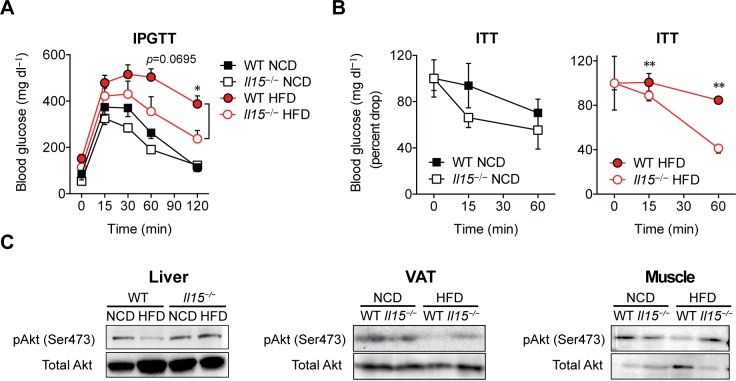
Fig 2. Il15−/− mice maintained on HFD do not become insulin resistant.
(A) Glucose tolerance test (GTT) following intraperitoneal glucose injection (2g/kg BW) in WT and Il15−/− male mice fed either NCD or HFD (mean ± SEM; n: WT-NCD = 11; Il15−/−NCD = 14; WT-HFD: n = 10; Il15−/−HFD: n = 8; ***p<0.05 vs WT). (B) Insulin tolerance test (ITT) following intravenous insulin injection (1U/kg BW). ITT data is presented as percent drop from basal glucose levels. (mean±SEM; n = 3–4; *p<0.05, **p<0.01 vs WT; ††p<0.01 vs NCD). (C) Immunoblot analysis of phosphorylation of AKT on Ser473 and total AKT levels in lysates from the liver, VAT and muscle tissues.

