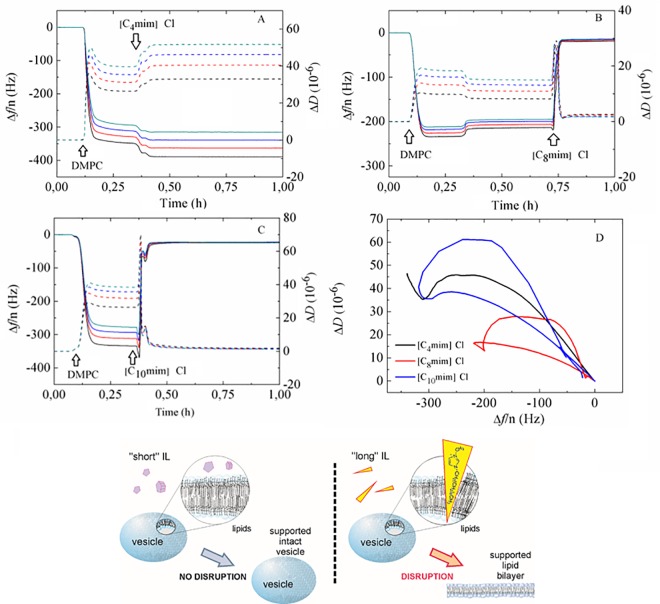
Fig 2.
Time evolution of Δ f/n (solid lines) and ΔD (dashed lines) during a QCM-D experiment of DMPC vesicle adsorption exposed to (A) [C4mim]Cl, (B) [C8mim]Cl and (C) [C10mim]Cl at a concentration of 50 mM. (D) ΔD vs Δf/n plot for all three mixtures. Black arrows indicate the time when a given sample was added. (E) Schematic representation of the action of short chain and long chain ionic liquids on DMPC SLVs.

