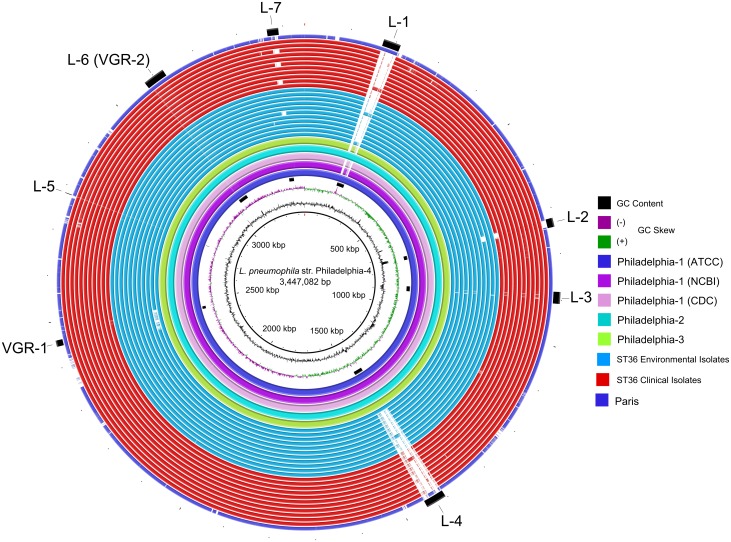
Fig 2. BRIG analysis plot comparing nucleotide content of all genomes analyzed in the current study.
As defined in the legend, clinical isolates are shown in red while environmental isolates are blue. From the innermost ring: first black ring, L. pneumophila str. Phildadelphia-4 used as reference; second black ring, G+C content; third multicolored ring, GC skew; black bars, loci identified on the outer black bars and labeled; light blue ring 1 through 11 represent E1-P, E2-N, E3-N, E4-N, E6-N, E7-O, E8-O, E9-O, E10-P, and E11-U, respectively; red ring 1 through 11 represent C1-S, C2-S, C3-O, C4-S, C5-P, C6-S, C7-O, C8-S, C9-S, C10-S, and C11-O, respectively; outer purple ring L. pneumophila str. Paris; the outer black ring/bars highlight regions of interest, e.g., L-1 is locus 1, L-2 is locus 2, VGR-2 is variable genomic region 2, etc.

