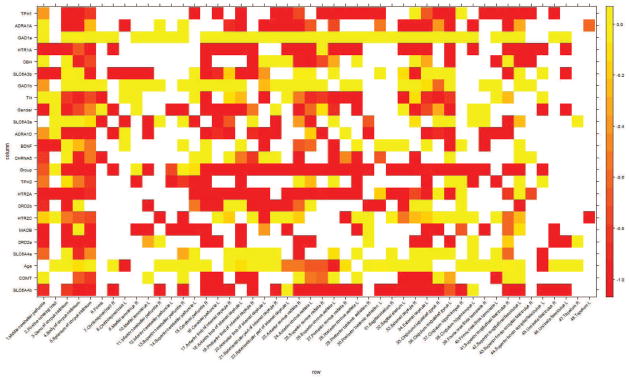
Figure 6.
The magnitude of FA diminishment as measured by the proportion of significant voxels with negative regression coefficients. The color key represents the extent of FA alteration. Red indicates the highest diminishment; yellow indicates no diminishment of FA value. White indicates absence of significant voxels for the specific combination of brain ROIs and genetic variants or demographic feature.

