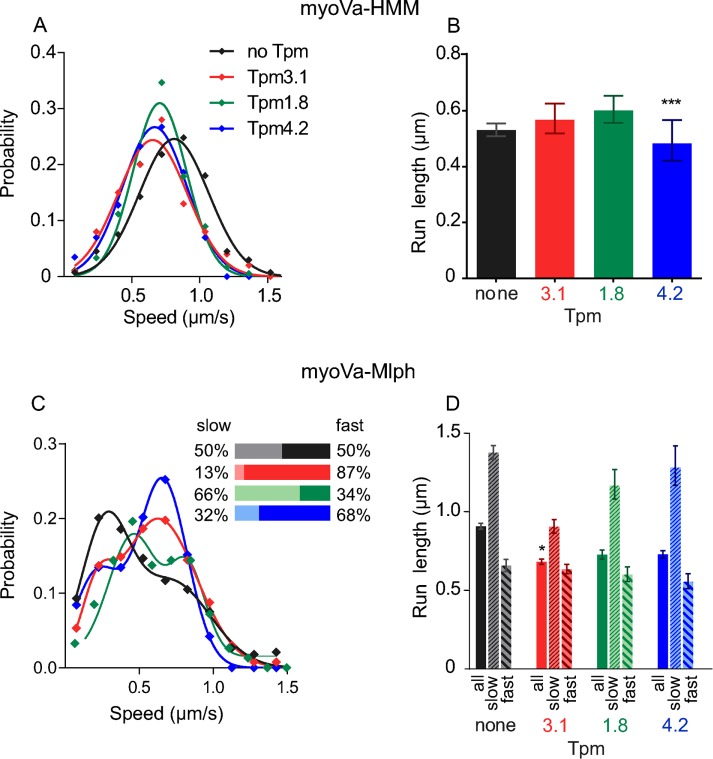
FIGURE 3:
Speeds and run lengths of myoVa-HMM and full-length myoVa-Mlph in a single-molecule assay. (A) Histogram and Gaussian fit of speeds for myoVa-HMM in the presence of no Tpm (black), Tpm3.1 (red; p < 0.01 compared with bare actin; ANOVA), Tpm1.8 (green), or Tpm4.2 (blue; p < 0.001 compared with bare actin; ANOVA). (B) Characteristic run lengths were determined from exponential fits to histograms. Error bars are 95% confidence intervals. ***p < 0.001 compared with bare actin (Kruskal–Wallis test). (C) Histogram and sum-of-two-Gaussians-fit of speeds for myoVa-Mlph in the presence of no Tpm (black), Tpm3.1 (red), Tpm1.8 (green), or Tpm4.2 (blue). Inset, relative percentage of slow vs. fast speeds; colors match those in the histogram. (D) Characteristic run lengths determined as in B. The first bar in each group (solid color) shows results from pooled data. The second bar (thin diagonal stripe) shows data from motors moving <500 nm/s, and the third bar (wide diagonal stripe) shows data from motors moving at >500 nm/s. Error bars are 95% confidence intervals. *p < 0.05 compared with bare actin (Kruskal–Wallis test). Run lengths of just the slow or the fast runs on actin-Tpm3.1 are not statistically different from those on bare actin. Values are listed in Supplemental Table S1. Conditions: pH 7.4, 150 mM KCl, 23°C.

