
FIGURE 2:
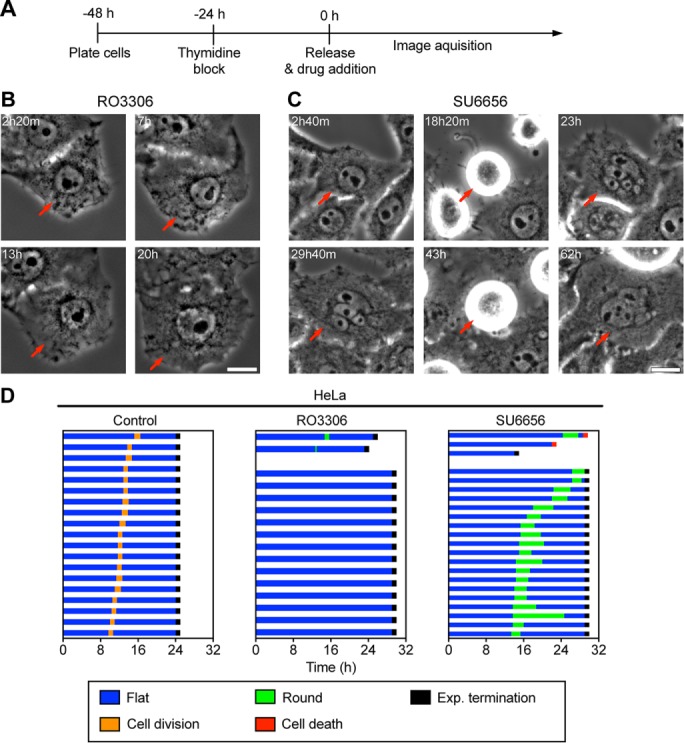
Antimitotic drugs induce polyploidy through endocycle/endomitosis. (A) Time line showing experimental procedure; t = 0 indicates the time of drug addition and corresponds to the timing in B–D. (B, C) Representative time-lapse images of HeLa cells treated with 6 μM RO3306 (B) or 6 μM SU6656 (C) for 24 or 40 h, respectively. Time is marked in the upper left, and the red arrow marks the same cell at different time points. Scale bar, 10 μm. (D) Cell fate profiles of HeLa cells exposed to indicated treatment; t = 0 corresponds to time of drug addition.